ISTELive 27 Audience

ISTELive 27 brings together thousands of education professionals from around the world, including administrators, technology leaders, curriculum developers, educators, library media specialists, and other key decision-makers and influencers. This diverse audience is involved in every aspect of teaching, learning, and education technology and is actively seeking innovative products, services, and solutions.

The expo is at the heart of the conference experience, giving companies the opportunity to connect with this influential audience, build relationships, showcase their solutions, and reach decision-makers from across the education landscape.

Charts and graphs

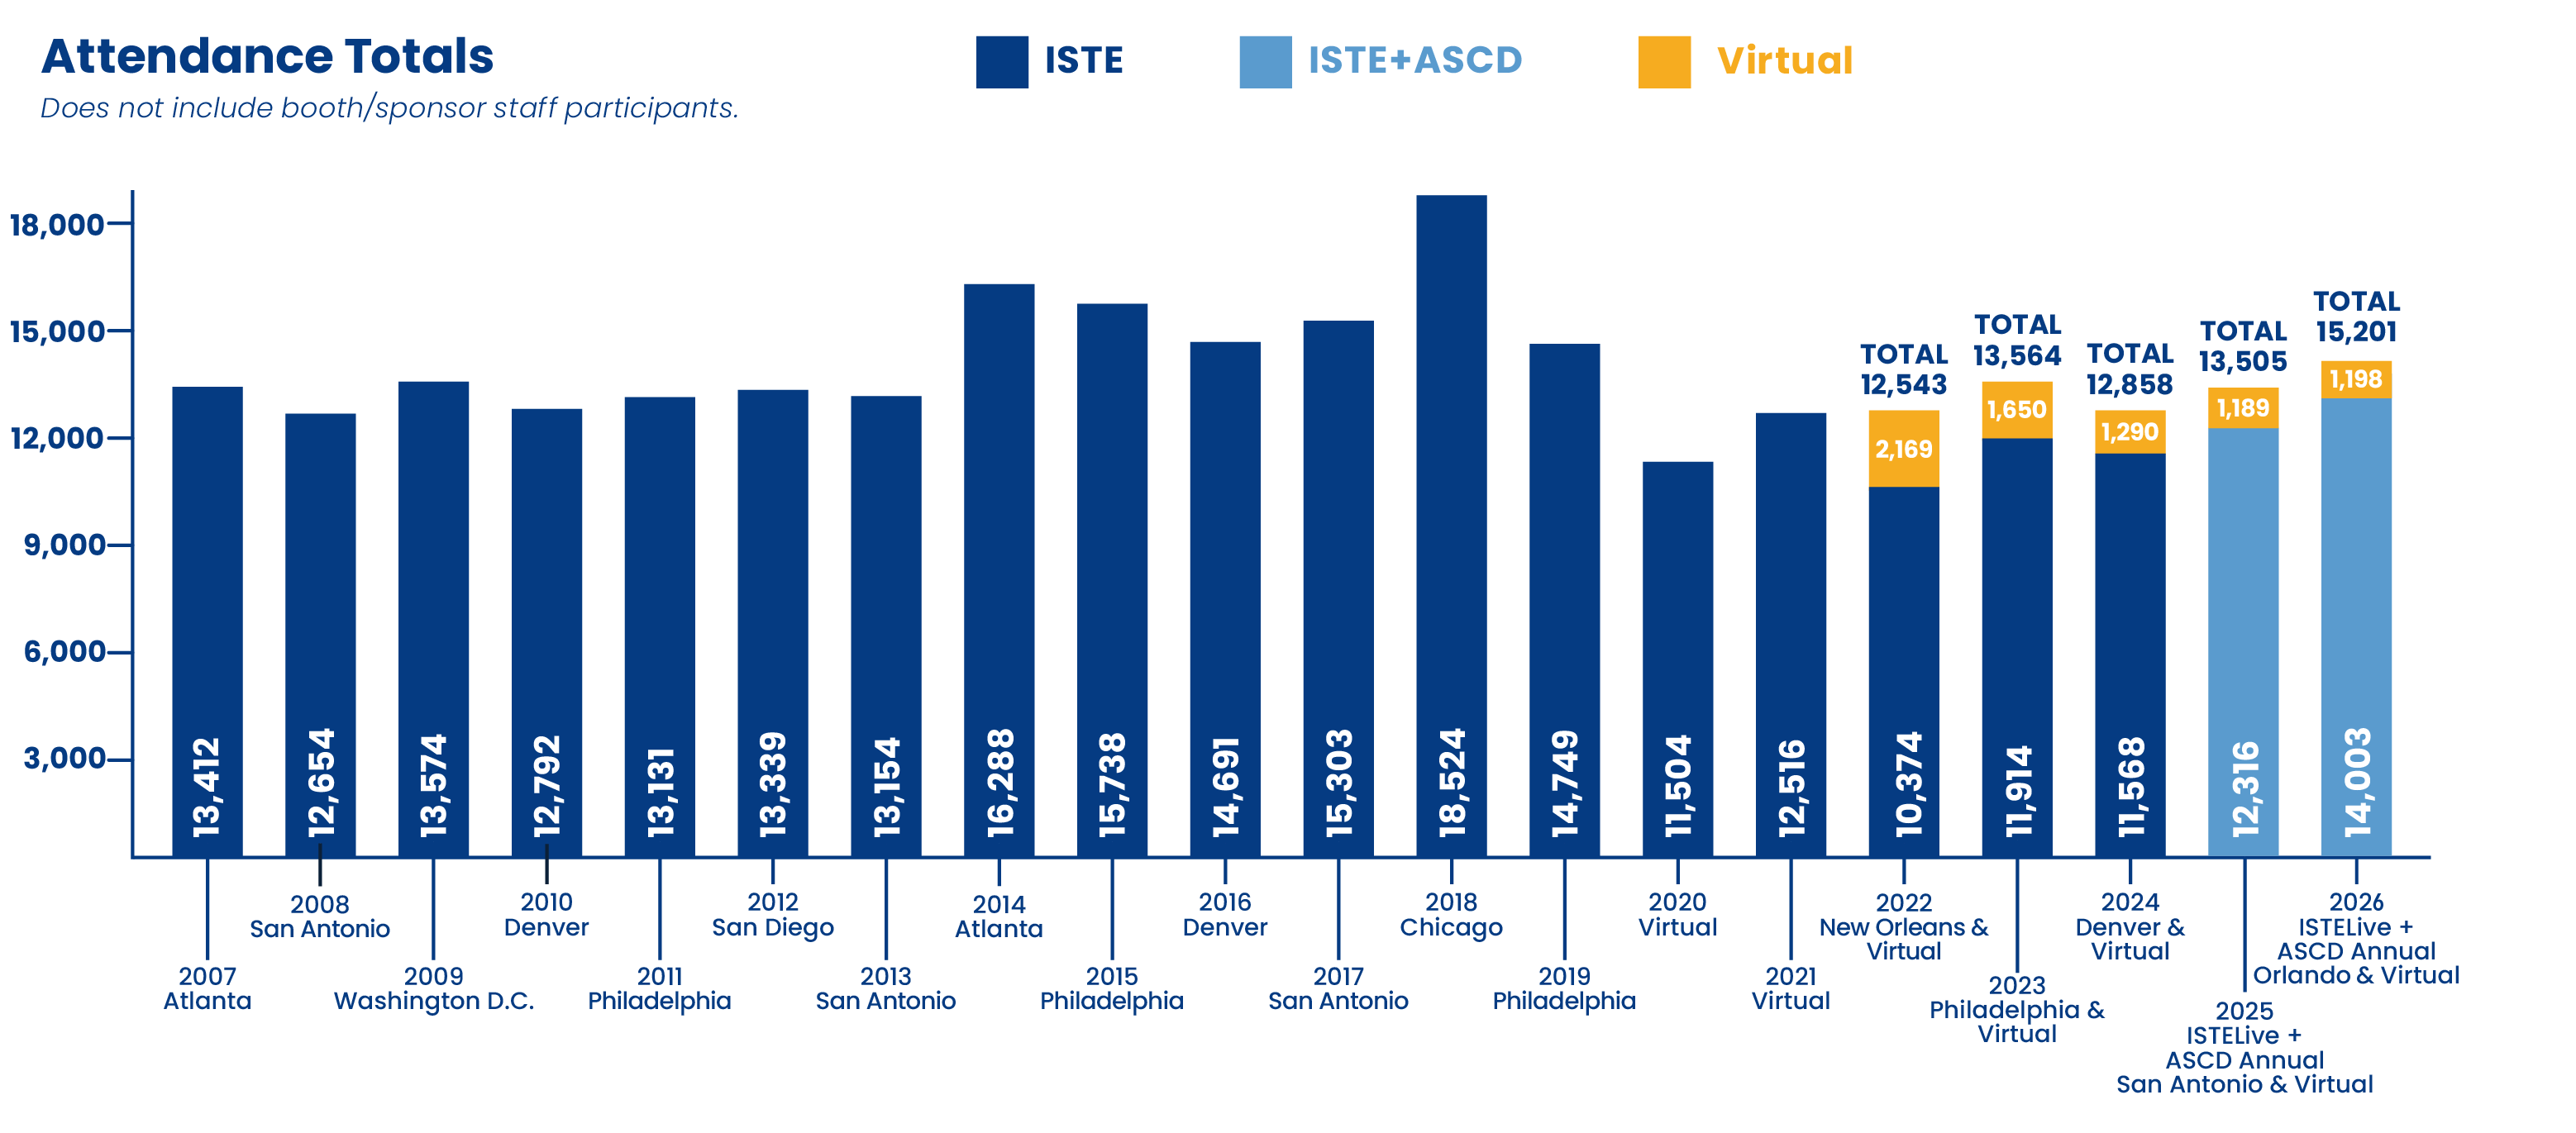
Attendance Totals

Attendance Totals infographic
Attendance Totals
ISTE+ASCD 14,003
Virtual 1,198
Total 15,201

Primary Curriculum Focus

Primary Curriculum Focus infographic
Curriculum Focus
Technology Education 18%
Not Applicable 15%
Elementary/Multiple Subjects 13%
Interdisciplinary (STEM/STEAM) 8%
Teacher Education 8%
Other 7%
Language Arts 6%
Mathematics 4%
Science 4%
Computer Science 4%
Special Education 3%
Social Studies or History 2%
Multi-language Learners 1%
Business/Economics 1%
Vocational 1%
Engineering 1%
Arts - Performing 1%
Arts - Visual 1%
World Languages 1%
Health/Physical Education <1%
Music <1%

Primary Job Role

Primary Job Role infographic
Job Role
Teacher/Faculty (PK-12) 23%
Other 13%
Technology Director/Coordinator/Coach 13%
Principal 7%
Instructional Coach 7%
Solution Provider (C-Level Executive/VP) 4%
Assistant Principal 4%
Solution Provider (Staff) 4%
Nonprofit/NGO/Government Staff 3%
Higher Ed Faculty/Instructor/Professor 3%
Curriculum Director 3%
Independent Consultant/Trainer 3%
Staff Developer/Trainer 2%
Librarian/Media Specialist 2%
Department Head/Chair 2%
Superintendent 1%
Chief Instructional Leader (CAO, Asst. Superintendent of Instruction) 1%
Higher Ed Administration/Leader 1%
Student 1%
District Executive Cabinet (Other) 1%
Counselor 1%
Assistant Superintendent (non-instructional focus) <1%
Retired <1%

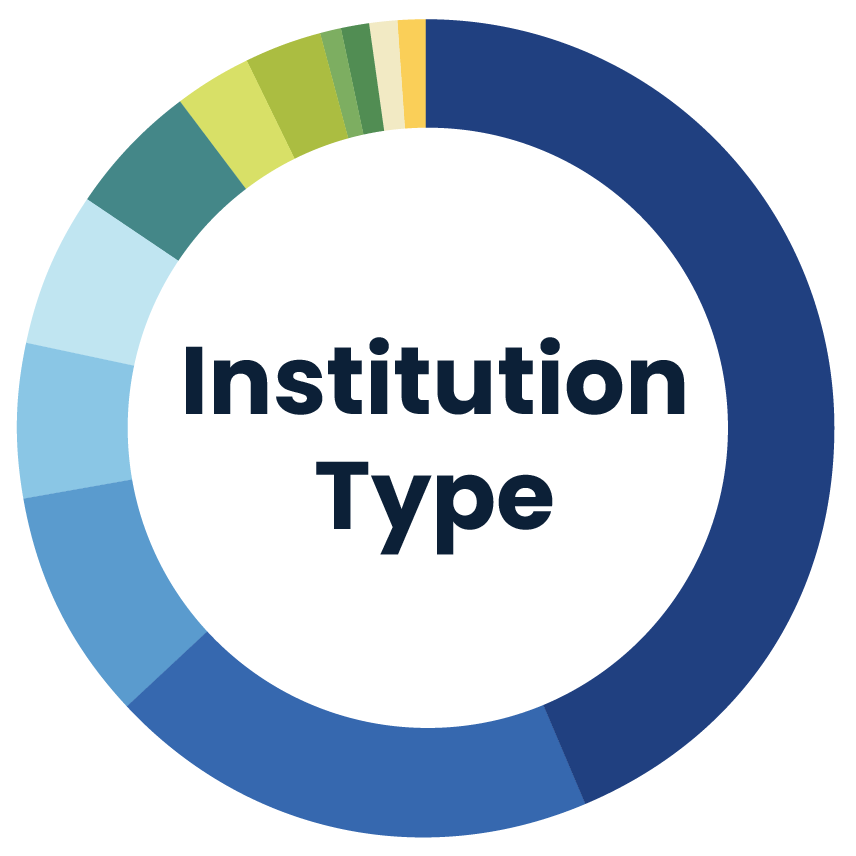
Institution Type

Institution Type infographic
Institution Type
School 43%
District 19%
Vendor/Solution Provider 9%
College/University 6%
Non-profit Organization 6%
Corporation 5%
Other 3%
International School 3%
Government Agency 1%
Service Agency/Regional Center 1%
State/Provincial Department of Education 1%
Ministry of Education/National Department of Education 1%

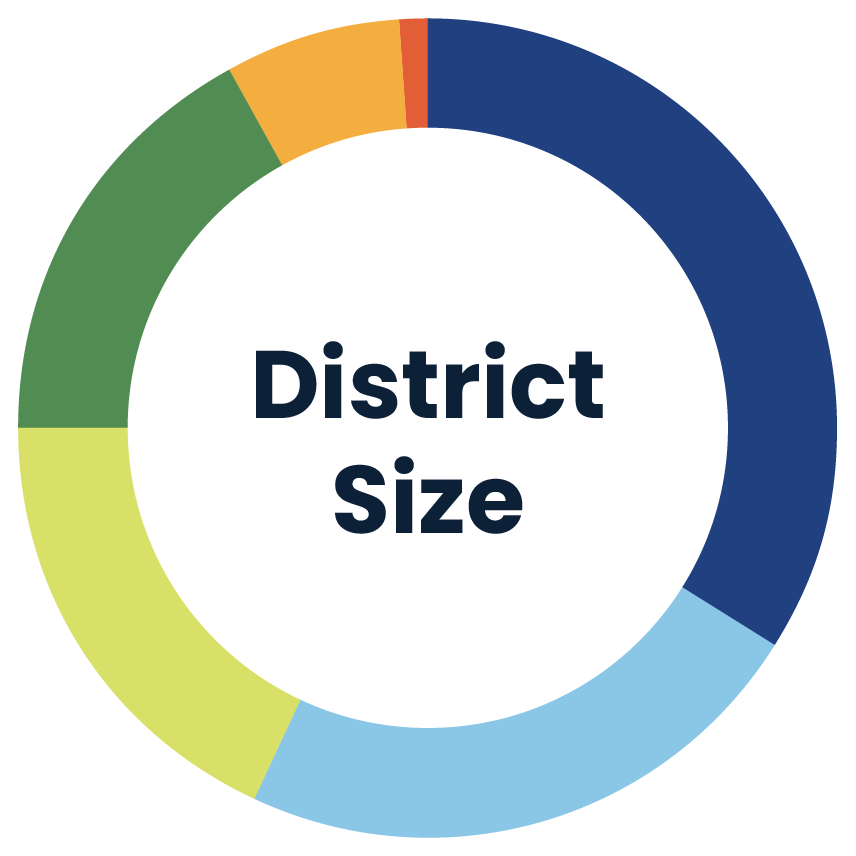
District Size

District Size infographic
District Size
0-2,499 Student Enrollment 34%
30,000+ Student Enrollment 23%
2,500-9,999 Student Enrollment 18%
10,000-29,999 Student Enrollment 17%
Not Applicable 7%
Other 1%

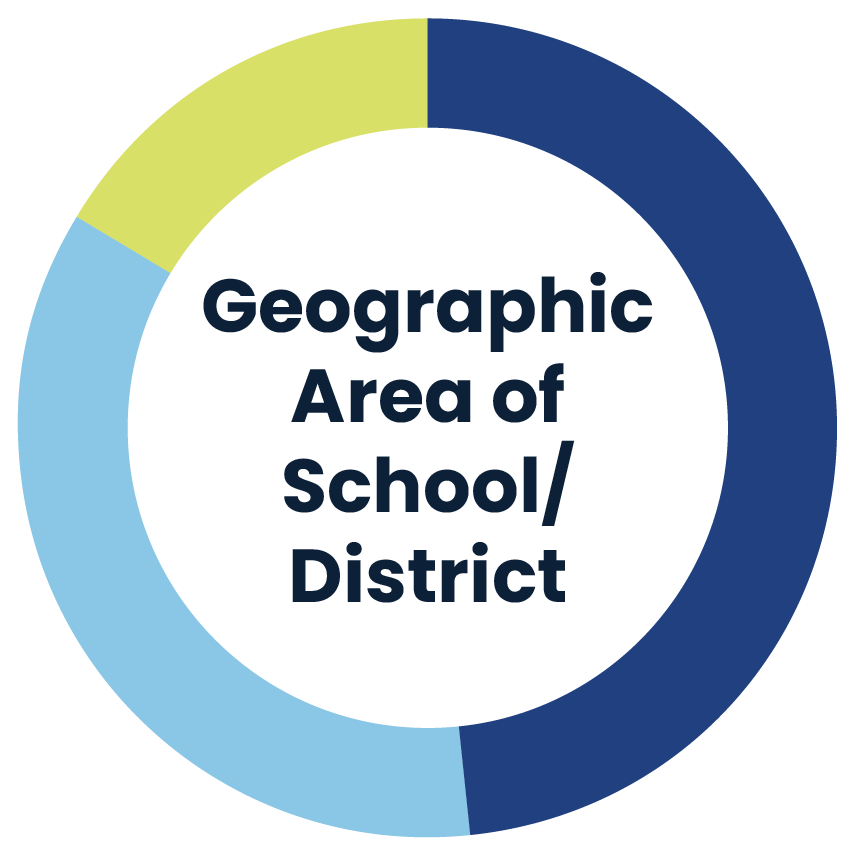
Geographic Area of School/District

Geographic Area of School/District infographic
Geographic Area of School/District
Urban 48%
Suburban 35%
Rural 16%

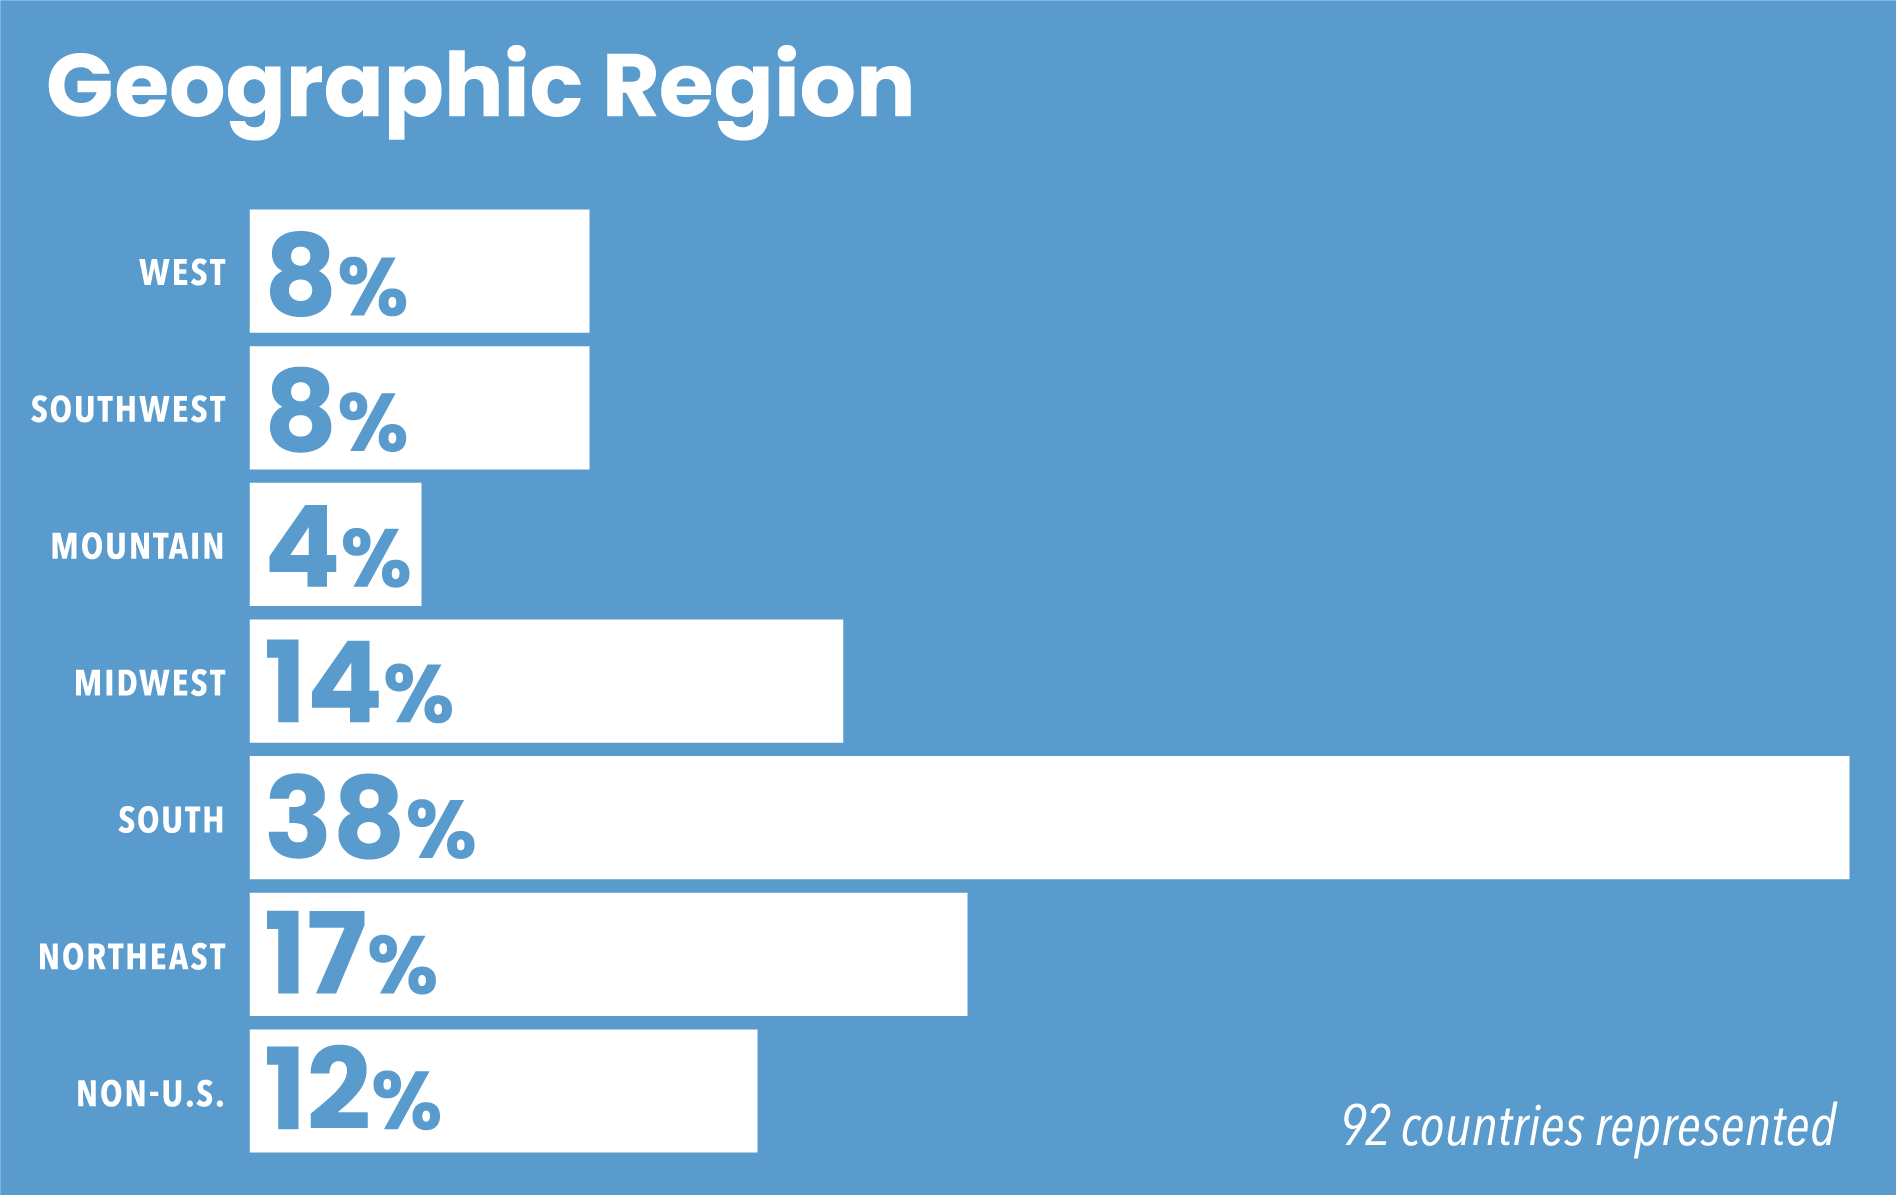
Geographic Region

Geographic Region infographic
Geographic Region
West 8%
Southwest 8%
Mountain 4%
Midwest 14%
South 38%
Northeast 17%
Non-U.S. 12%

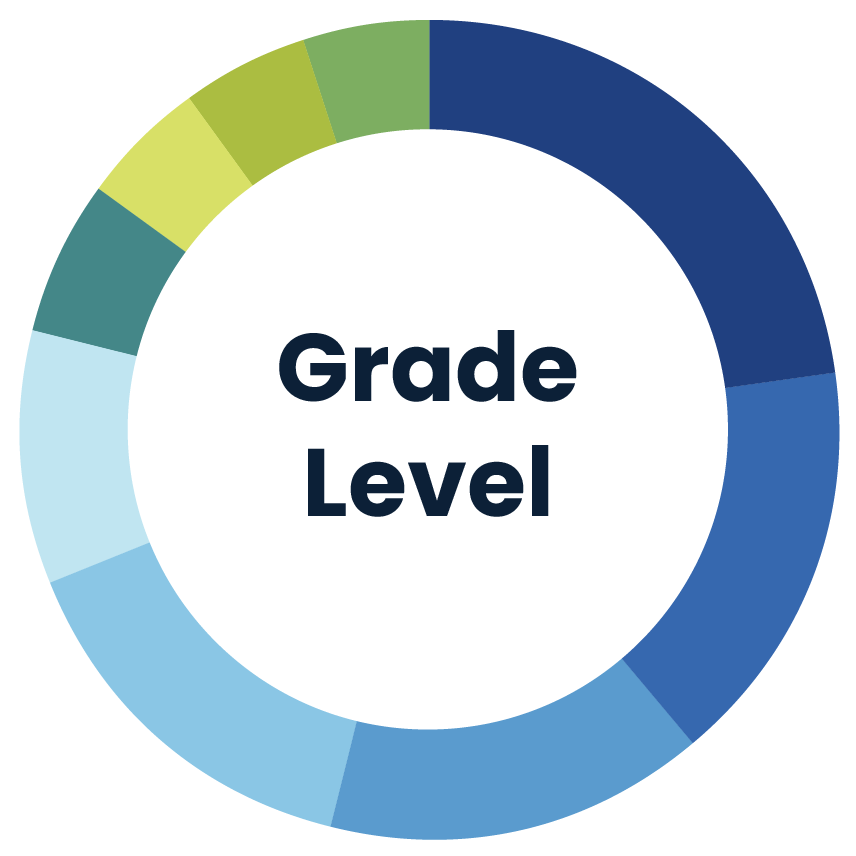
Grade Level

Grade Level infographic
Grade Level
9-12 23%
PK-5 16%
6-8 15%
PK-12 15%
Community College/University 10%
3-5 6%
6-12 5%
Not Applicable 5%
PK-2 5%

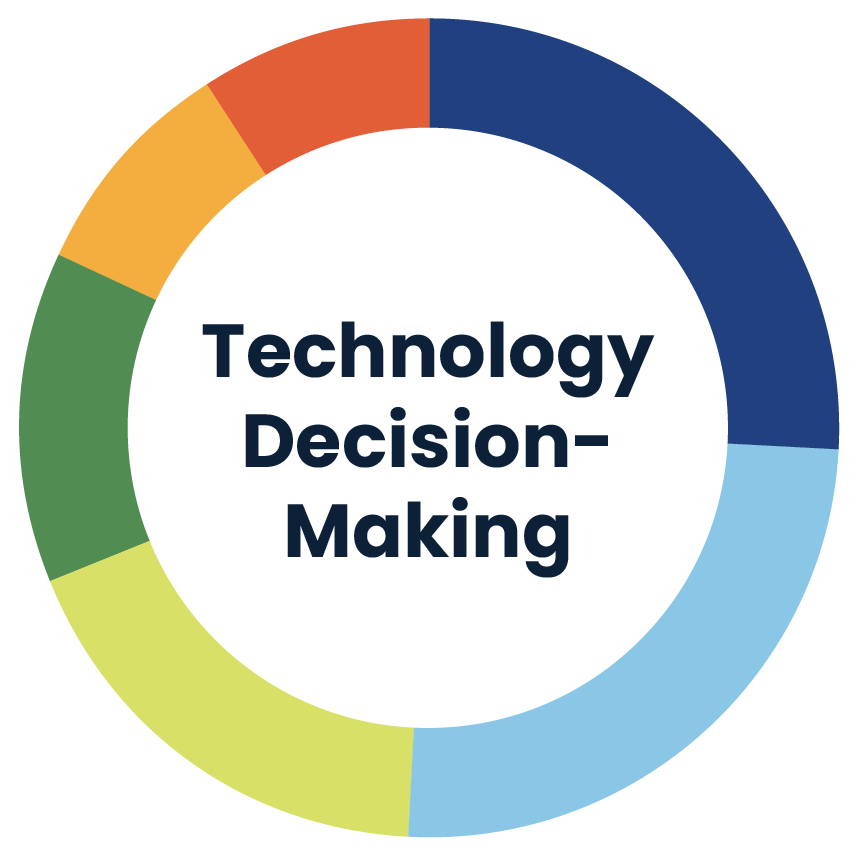
Technology Decision-Making Responsibility

Technology Decision-Making Responsibility infographic
Technology Decision-Making Responsibility
Recommend 26%
Explore/Research 25%
Pilot/Test 18%
Decide 13%
Purchase 9%
None 9%

Professional Development Decision-Making Responsibility

Professional Development Decision-Making Responsibility infographic
Professional Development Decision-Making Responsibility
Recommend 28%
Explore/Research 24%
Pilot/Test 16%
Decide 14%
None 10%
Purchase 8%

Audience data from the ISTELive and ASCD Annual Conference 26, held in Orlando, Florida and online.